Why Option Volume and Open Interest Tell Different Stories
Option chains place volume and open interest next to each other, which makes them look like variations of the same measure. They are not. One describes activity during the current session, while the other reflects contracts that remain open after previous trading.
Understanding that difference matters in options trading because a busy contract is not necessarily one with deep, established participation. A sudden burst of volume can appear at a strike with little existing interest, while a heavily populated contract may trade quietly for most of the day.
Neither figure reveals direction by itself. Traders still need price, spread, volatility, and market context before drawing conclusions.
Volume Captures Today’s Activity
Option volume counts contracts traded during the session. If a contract changes hands 5,000 times, its displayed volume rises accordingly.
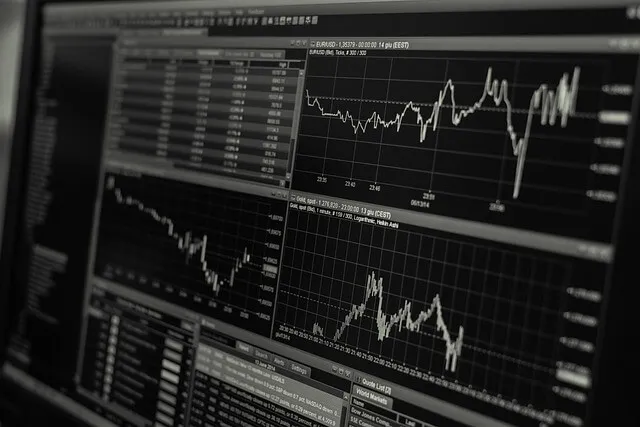
Image Source: Pixabay
A sharp increase can follow earnings, an economic release, a technical breakout, or a large institutional transaction. Yet the number does not say whether buyers initiated the trades, sellers initiated them, or positions were opened rather than closed.
Suppose a stock breaks above a three-month consolidation after reporting stronger revenue. Call volume at the next monthly expiry surges to 20,000 contracts. The activity looks bullish, but some participants may be selling covered calls into the rally, while others close profitable calls bought before earnings. The same volume total can contain several opposing motives.
Experienced traders examine whether contracts traded near the bid, ask, or midpoint. Repeated transactions near the ask can suggest aggressive demand, while trades near the bid may indicate selling. Even then, multi-leg spreads and dealer hedging can complicate the interpretation.
Open Interest Shows What Remains Outstanding
Open interest measures contracts that have not been closed, exercised, or allowed to expire. It changes after trades are cleared, so the displayed figure often reflects the previous session rather than live intraday positioning.
If one trader opens a new call position and another takes the opposite side, open interest can rise. If both participants close existing positions, it can fall. When an opening trader transacts with someone closing, the total may remain unchanged.
That clearing process is why comparing today’s volume directly with current open interest can mislead. The volume is intraday information, while the open-interest figure may not incorporate those trades until later.
Open interest can support tighter bid-ask spreads because market makers expect recurring activity, but it does not guarantee good execution. A contract with 50,000 open positions can still trade poorly if current quotes are wide or the underlying market is moving rapidly.
The Two Measures Can Diverge for Valid Reasons
A contract showing low open interest and unusually high volume may be attracting new attention. It may also be experiencing mass liquidation before expiration. The next day’s open-interest update helps separate those possibilities.
If volume reaches 15,000 contracts and open interest subsequently rises by roughly the same amount, much of the activity probably created new positions. If open interest falls, the heavy volume likely included substantial closing activity. The relationship is informative, but exact conclusions remain difficult because contracts can change hands several times in one session.
Here lies a counterintuitive insight: record volume can mark the end of a trade rather than the beginning. When a widely anticipated event finally occurs, early participants may use the resulting liquidity to exit. Traders who mistake their selling for fresh conviction can arrive just as the original position is being unwound.
Large open interest also does not create an automatic support or resistance level. Dealer hedging around a major strike can influence the underlying price, particularly near expiration, but the effect depends on whether dealers are net long or short options and how quickly market conditions change.
Liquidity Requires More Than a Large Number
Volume and open interest are useful screening tools, not complete liquidity tests. The quoted spread, contract price, trade size available at each level, and responsiveness of market makers matter more when an order must actually be filled.
A near-the-money contract with moderate open interest and a narrow spread may offer cleaner execution than a far-out-of-the-money contract displaying enormous open interest but only occasional trades. Beginners often choose the contract with the largest headline number. Experienced participants watch what it costs to enter and, just as importantly, what it may cost to leave.
Before entering options trading positions, compare volume with the previous day’s open interest, then check the following session for changes in outstanding contracts. Review the bid-ask spread and recent trade prices rather than assuming high activity means easy execution. If volume surges around an event, determine whether price and implied volatility confirm new demand or suggest that existing traders are using the rush to exit.