Analyzing Intermarket Relationships Using TradingView
The trading profession demonstrates that markets tend to move together. Prices reflect their movement directions through intermarket relationships when traders examine stocks, bonds, commodities, and currencies. Market interaction analysis provides traders with insights into market trends which support better investment choices. TradingView presents an invaluable solution for intermarket analysis because it offers traders one platform for analyzing multiple markets with necessary comparison and evaluation tools.
Analysis of intermarkets focuses on inspecting correlations and divergences between diverse market sectors. The intermarket analysis technique enables traders to track current relationships between stocks versus bonds and fluctuations between the US dollar and commodity prices such as gold. When one market adjusts its value, other related markets often react, and traders can recognize these shifts before full market transitions occur. The direction assets move relative to each other serves traders for developing strategies benefiting different market conditions with equity trading, futures trading, or currency trading.
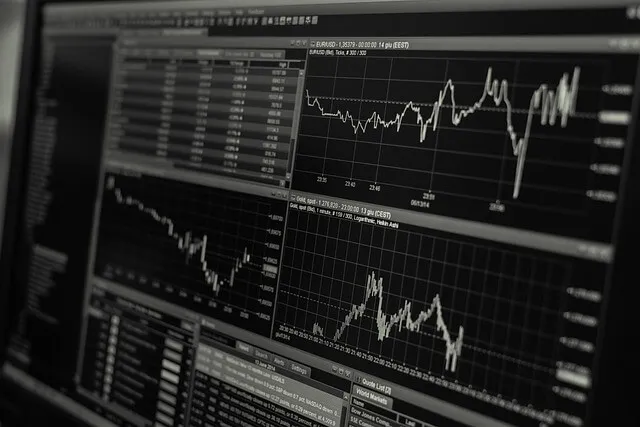
Image Source: Pixabay
Intermarket analysis delivers its greatest value as a tool which reveals additional meaning behind market activity. Traders increase their perspective by studying multiple instruments and identifying connections which are hard to detect at a surface level. Stock price strength combined with bond market weakness, often indicates developing optimistic market sentiment as well as expanding risk-taking behaviors from investors. Equities together with rising gold prices may indicate that investors protect their funds by preparing for market uncertainties through hedging strategies. Such market understanding enables traders to decide appropriate position sizes and conduct risk management strategies.
The primary benefit of TradingView for this analysis method results from its capability to synchronize different markets on the same chart. TradingView charts provides users with a functionality that enables the simultaneous display of indices, commodities, currencies, and cryptocurrencies in one chart to show market interrelationships. Visual clarity lets traders rapidly detect market relationship changes because they can identify early signs of standard market behavior shifting. Customizable technical indicators in these charts enable traders to extract actionable insights from intermarket movements.
Beginning traders will probably find the multiple active elements challenging during their early attempts at this kind of analysis. After enough exposure and practice most traders reach a point where they understand how selected markets interact with one another. Gradually, the interconnections between crude oil prices and energy stocks, and treasury yields and bank shares become instinctive to traders. TradingView platforms enable smoother learning through real-time data analyzing tools while customers can access historical performance metrics and participate in trader-driven communities for information exchange to enhance learning.
The TradingView platform supports relationship tracking across multiple time frame scales. The platform allows traders to modify their analysis level by extending or shortening time spans to suit their specific trading objectives. Fast-moving markets demand rapid trading adaptability since intermarket relationships transform swiftly due to news updates, economic data releases, and central bank decisions.
A trading approach that utilizes intermarket analysis provides better access to a broader understanding of the factors driving price movements. Traders who focus on the entire market landscape have superior performance as they avoid reacting solely to isolated price movements. Through TradingView charts, traders obtain a strong analytical instrument which allows them to conduct complex relationship analysis that supports more intelligent trading decisions. The application of wide-ranging market relationships through connected data analytics becomes a key advantage in maintaining sustainable trading achievement.

Comments